Troubleshooting desktop application problems
Deprecation notice
Dolby.io Communications SDK for Desktop has been deprecated. For building native desktop applications, we recommend using the vanilla Electron framework with the latest Web Client SDK.
This document provides information on how to troubleshoot problems in desktop applications created using the Desktop SDK. Follow these instructions to create a launcher script and open your application in debugging mode.
Opening the application in debugging mode
To open your application in a new window with the developer tools, you need to create a launcher script. The script needs to disable Node.js, since Node.js APIs introduce new symbols to the JavaScript environment, which may cause application issues. The script can also support additional functionalities, such as:
-
Disabling web security to enable the following actions: serving content from HTTPS locations that are secured with the self-signed certificates, violating same-origin policy rules, or loading resources through HTTP protocols on sites served through HTTPS.
-
Enabling webrtc-internals to get information about ongoing WebRTC sessions and inspect webRTC conference properties.
-
Accessing Node.js APIs in the application. If you need to access the Node.js APIs when
nodeIntegrationis disabled, prepare a preload script to always have access to the Node.js APIs. The Desktop SDK should run the script before loading the application. The following code snippet presents an example of a preload script:
// A function that is available in the preload script context but can not be invoked from the application level:
function writeSomeFile() {

 // Create an example that shows a Node.js integration in the preload script context:
 var fs = require('fs');

 // Write the example to a file:
 fs.writeFileSync('myfile.txt', 'Hello, it works!', 'utf-8');
}

// Expose the function to the application using the global window object:
window.writeSomeFile = writeSomeFile;

//The application can now invoke window.writeSomeFile(), which results in using the Node.js fs module.
The following code sample presents an example of a launcher script, which contains the path to the preload script, and opens the application in the debug mode:
const { app, BrowserWindow } = require('electron')

// Allow serving content that is protected by the self-signed certificates:
app.commandLine.appendSwitch('ignore-certificate-errors', 'true');

// Create a new window:
function createWindow(url)
{
 let win = new BrowserWindow(
 {
 webPreferences:
 {
 // Disable NodeJS in the opened window:
 nodeIntegration: false,

 // Allow loading HTTPS content through the HTTP protocol:
 allowRunningInsecureContent: true,

 // Disable the same-origin policy:
 // WARNING: This setting crashes debug builds.
 webSecurity: false,

 // Allow the preload script to export content to the application window in a way that is not recommended from the security point of view:
 contextIsolation: false,

 // Run the preload script:
 preload: "/path/to/my/preload.js"
 }
 });
 win.loadURL(url);
 return win;
}

async function main()
{
 // Open the WebRTC internals window:
 createWindow('chrome://webrtc-internals')

 // Open the local Web SDK test application window with enabled developer tools:
 createWindow('https://127.0.0.1:8081/').webContents.openDevTools();
}

app.on('ready', main);
To open the application in the debug mode, run the launcher script:
# macOS
Electron.app/Contents/MacOS/Electron ./electron_app.js

# Windows
electron.exe ./electron_app.js
Enabling logs
Enable logs to gather more detailed diagnostic information. You can use the logs to debug your application or to identify problems on the Desktop SDK side. To enable logging, run the following command:
# macOS
Electron.app/Contents/MacOS/Electron --enable-logging=stdout --v=1 ./electron_app.js

# Windows
electron.exe --enable-logging=stdout --v=1 ./electron_app.js
Identifying problems on the Desktop SDK side
If you experience crashes and cannot find the root cause of your problem, check if the issue exists on the Desktop SDK side.
Verifying the renderer process crashes
A blank page or disconnected developer tools in your application may indicate that the renderer process crashed. If you have verified that the issue is not on the application side, contact the Dolby support team.
Verifying the Dolby Voice Client process crashes
If you experience conference issues that occur together with DOM exceptions or errors informing that the native JS APIs cannot access the DolbyVoice and DolbyVoiceConference objects, check if the DVC process works correctly. Use the following procedure to check if the DVC process crashed:
- Open the
chrome://tracingwindow in your application window.
async function main()
{
 // Open Chrome Tracing window:
 createWindow('chrome://tracing')

 // Open the local Web SDK test application window with enabled developer tools:
 createWindow('https://127.0.0.1:8081/').webContents.openDevTools();
}
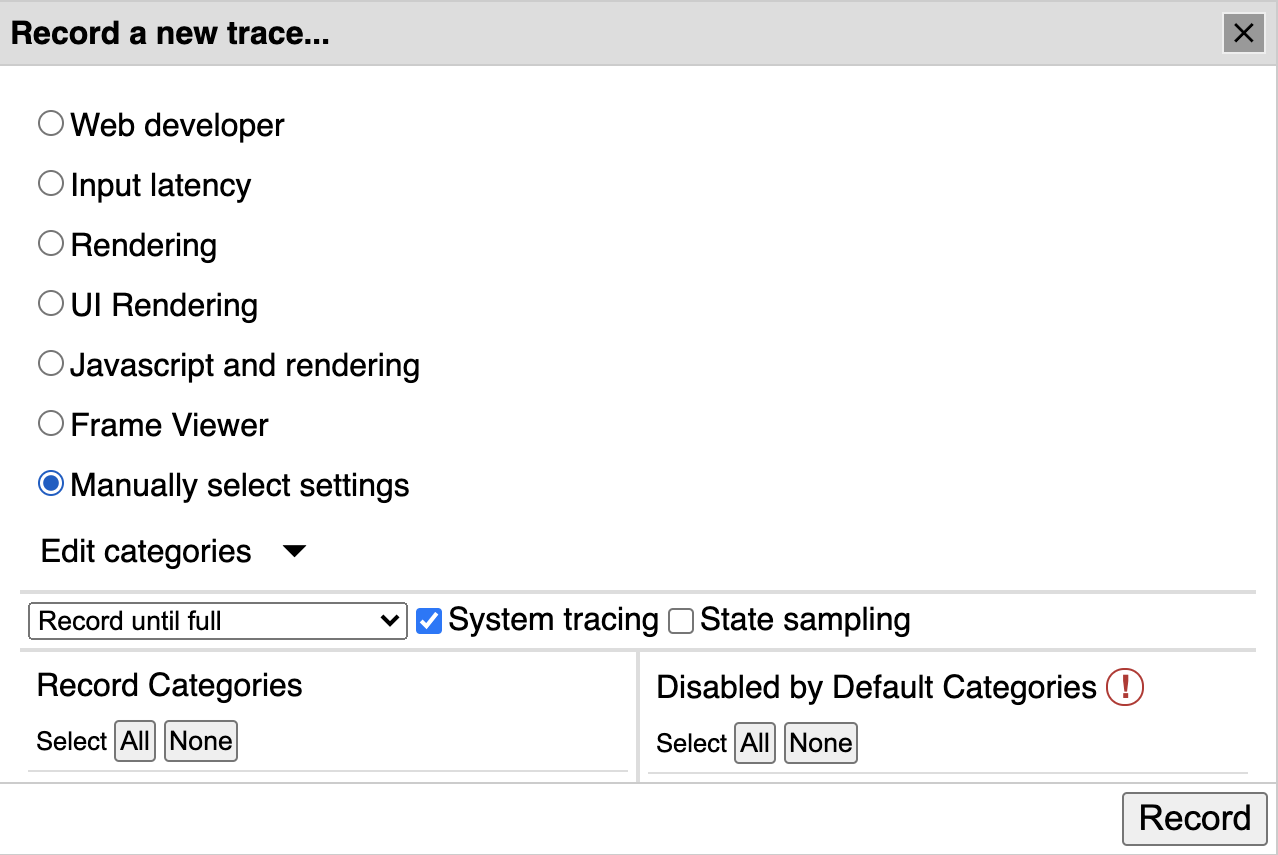
- Record a new trace.

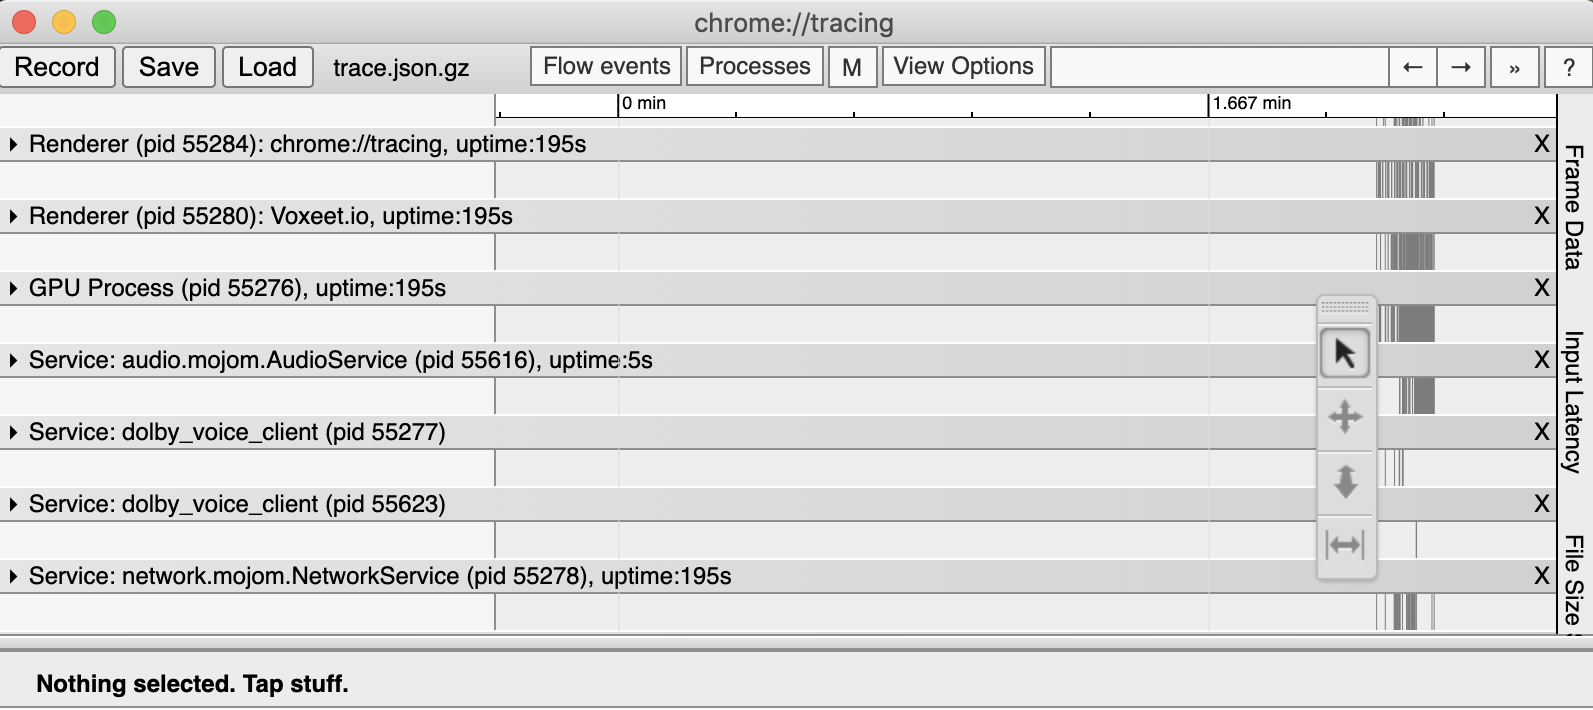
- Reproduce the conference issue. 4. Stop recording the trace. 5. Check the records for a service called
dolby_voice_client. If there is more than one instance of thedolby_voice_clientservice, it is possible that the DVC process crashed and restarted. If this is the case, contact the Dolby support team.

Updated about 1 year ago