Live Monitoring
Learn how to monitor your streams from the Streaming Dashboard
The Live monitoring section of the Streaming Dashboard is the place to view all of your active streams. This page displays all active ingest streams and streams that have been offline for the last hour. At a glance, you can check the number of connected viewers, stream duration, and status of your streams. Live monitoring allows you to access information about your streams to quickly diagnose and triage any issues.
Note: The live monitoring page currently only displays ingress statistics, and does not provide information on egress or client-side statistics.
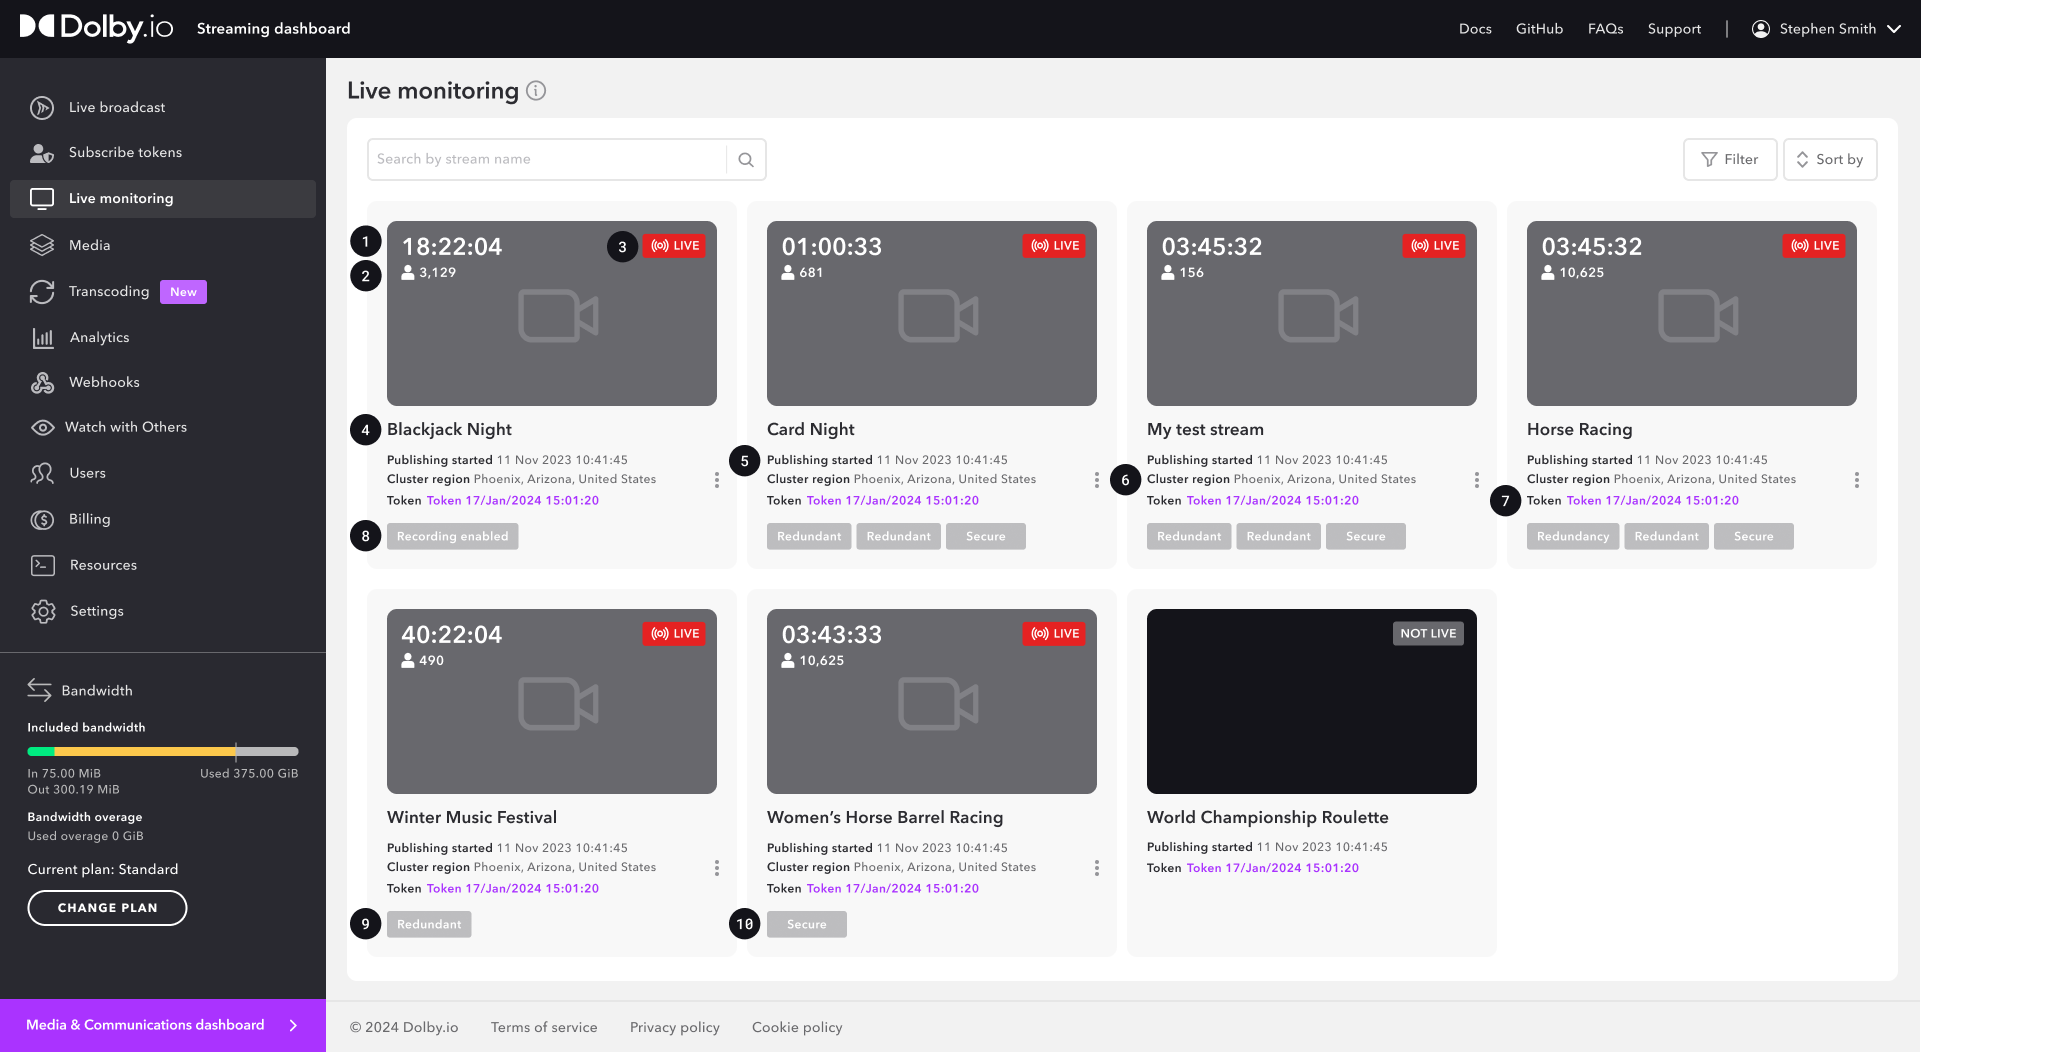
By default, the Live monitoring page displays all of your streams in a grid view with the following details for each stream.
1 Duration: The amount of time the stream has been live, displayed in days, hours, minutes, and seconds (DD:HH:MM:SS).
2 Connected viewers: The number of client side viewers that are connected to the stream.
3 Live status: Indicates if the stream is currently live or offline.
4 Stream name: The name of the ingest stream.
5 Publishing started: The date and time the stream was created.
6 Cluster regions: Indicates what regions the stream is ingesting to. This indicates which data center is used as the origin when broadcasting. Note: The ingest cluster region displays the most common ingest cluster region used for all feeds in the stream, and hovering over displays additional cluster regions associated with the stream.
7 Token: The publish token associated with the stream.
8 Recording enabled status: Indicates whether recording is enabled on the stream token settings. Note: This does not indicate if the recording is currently active.
9 Redundant status: Indicates whether the stream has a redundant option associated with it for failover. For example, if the stream has multiple quality layer feeds, and the highest quality layer has redundant ingest enabled, the stream will be tagged as redundant.
10 Secure viewer status: Indicates whether the stream requires secure subscriber tokens to view. The secure viewer setting is enabled on the stream token settings. If the secure viewer setting is enabled, the hosted player will not play the stream.
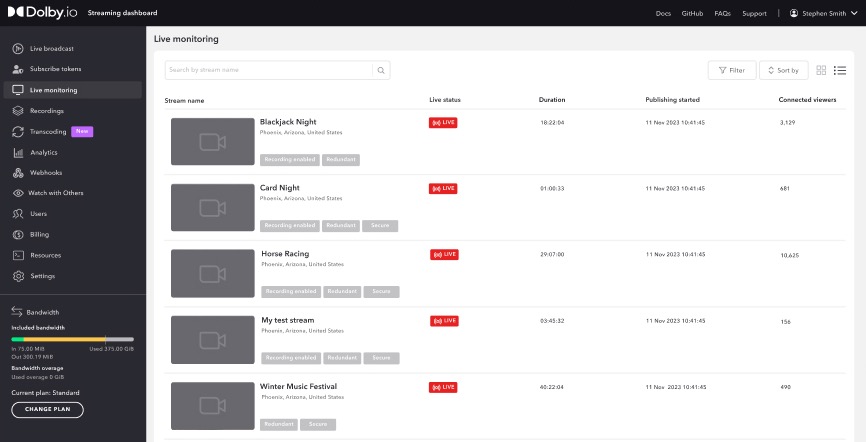
You can also toggle to display all of your streams in list view.
Detailed View
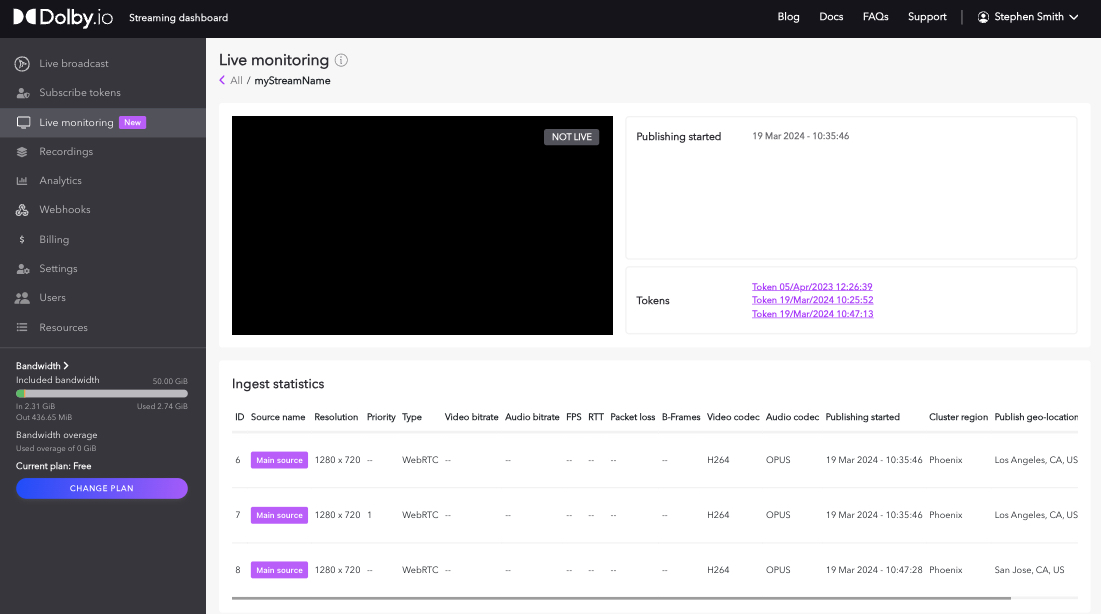
Ingest Statistics
The details page for each stream provides the following ingest statistics:
- ID: Unique numerical identifier to identify feeds in Live Monitoring dashboard.
- Source name: The name of the source. If a source has been set as the main source by not specifying a
sourceId(for WebRTC streams) orsimulcastID(for RTMP or SRT streams), the Main Source tag is displayed, this is the same tag used when configuring multiple publishing sources. - Resolution: The video resolution.
- Priority: Indicates the priority set for the feed.
- Type: The broadcast protocol - RTMP, SRT, or WebRTC.
- Video bitrate: The ingest video bitrate measured in kbps.
- Audio bitrate: The ingest audio bitrate measured in kbps.
- FPS: Frames per second.
- RTT: The round trip time measured in ms. A lower RTT value is preferred.
- Packet loss: The ratio of number of packets lost to the number of packets received over an average of five seconds. This value is measured as a percentage. Note: For streams using the type RTMP, packet loss will always be 0.
- B Frames: Indicates the presence of b-frames in the feed. For best results, we recommend disabling b-frames in your feed. For more information, see Configuring Simulcast.
- Video codec: The video codec detected.
- Audio codec: The audio codec detected.
- Publishing started: The day, month, year, and time the feed was created.
- Cluster region: Indicates what regions the stream is ingesting to.
- Publish geo-location: The location from which the feed is being published.
- IP address: The IP address from which the feed is publishing from.
Note: Viewing the detailed view page for a stream uses up the bandwidth of one viewer.
Redundant Ingest Statistics
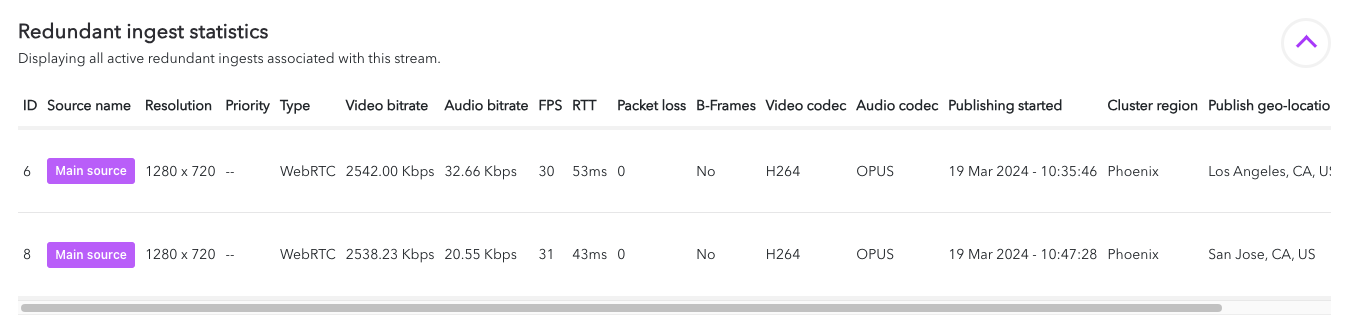
The details page for each stream also displays redundant ingest statistics if redundant ingests are detected.
Ingest Telemetry
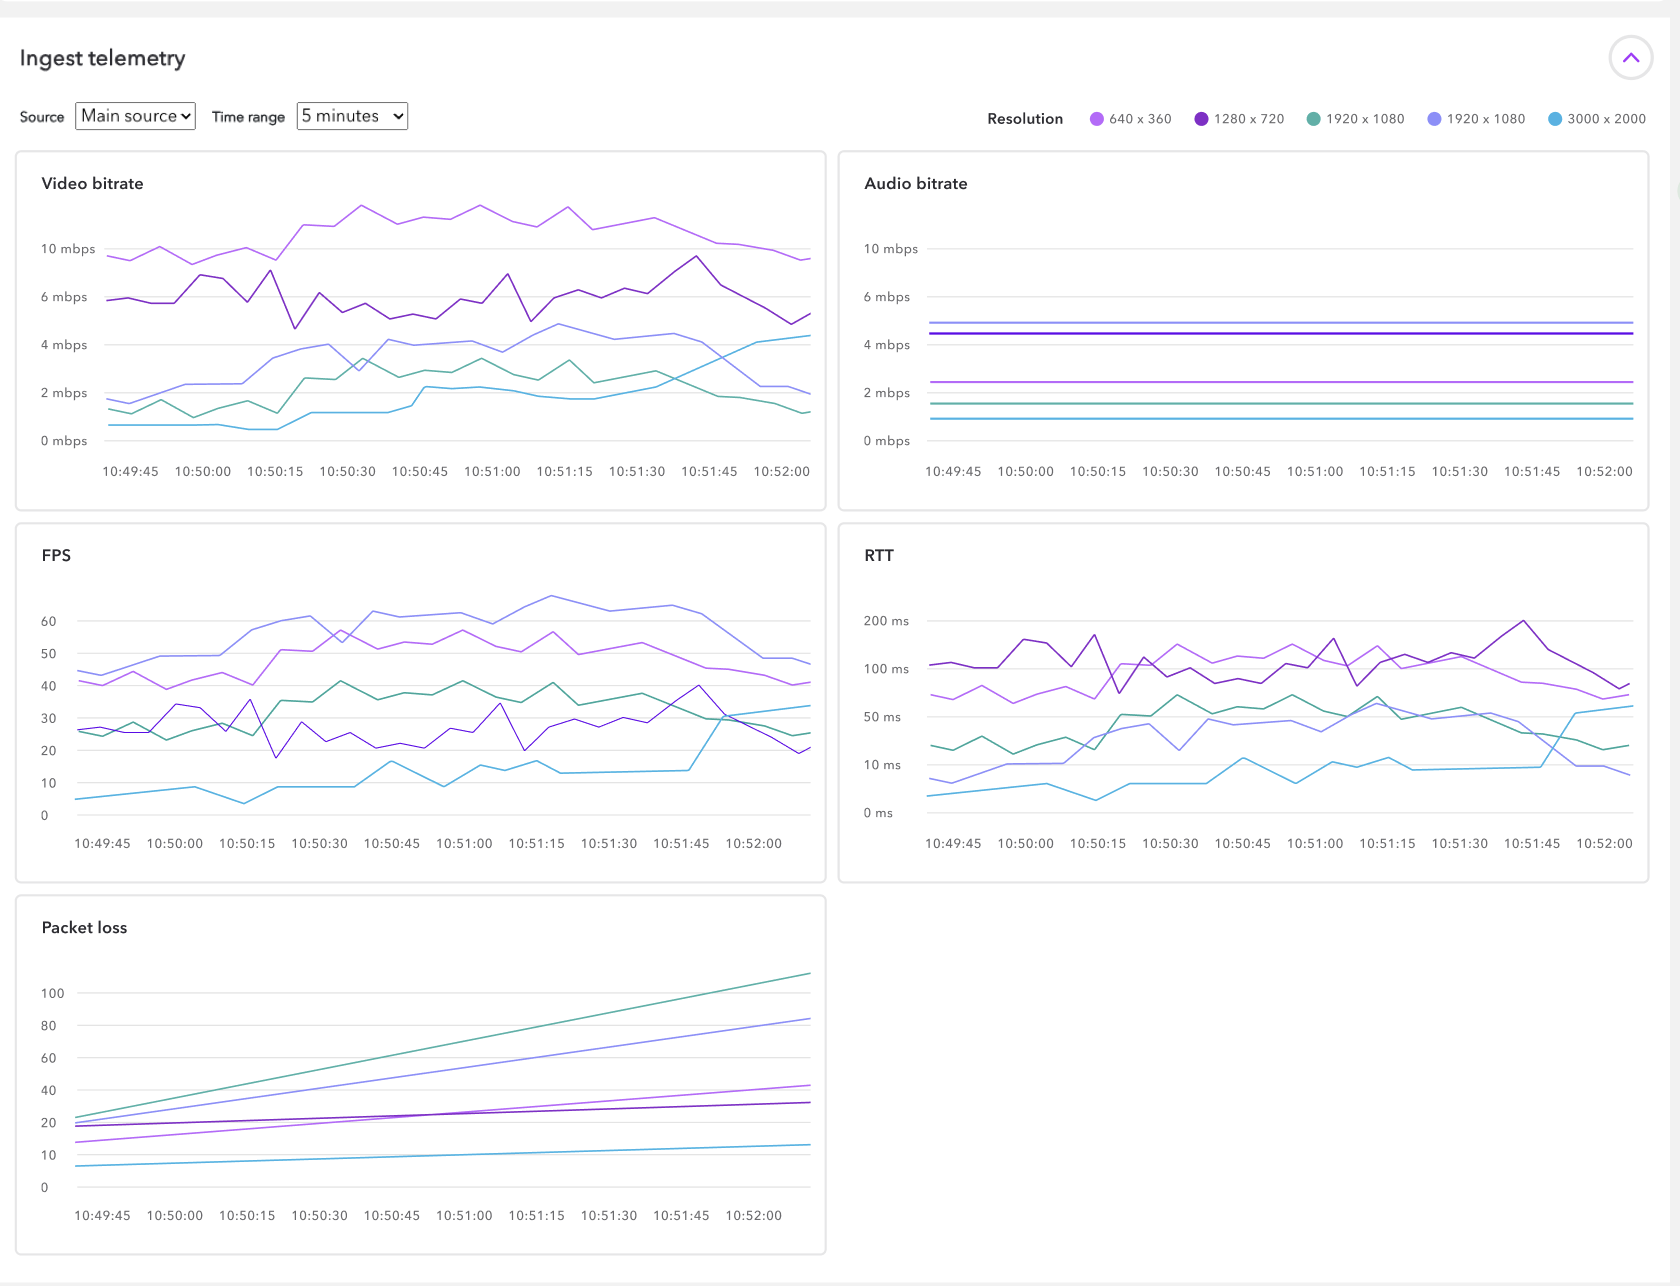
The details page for each stream displays telemetry data for the Video bitrate, Audio bitrate, FPS, RTT, and Packet loss in the form of time series data graphs. The graphs provide all resolutions associated with the source selected from the drop-down menu. You can also select the time range to display from the drop-down menu. Hovering over a point on the data graphs displays the source name, resolution, timestamp, and time series data value.
Events
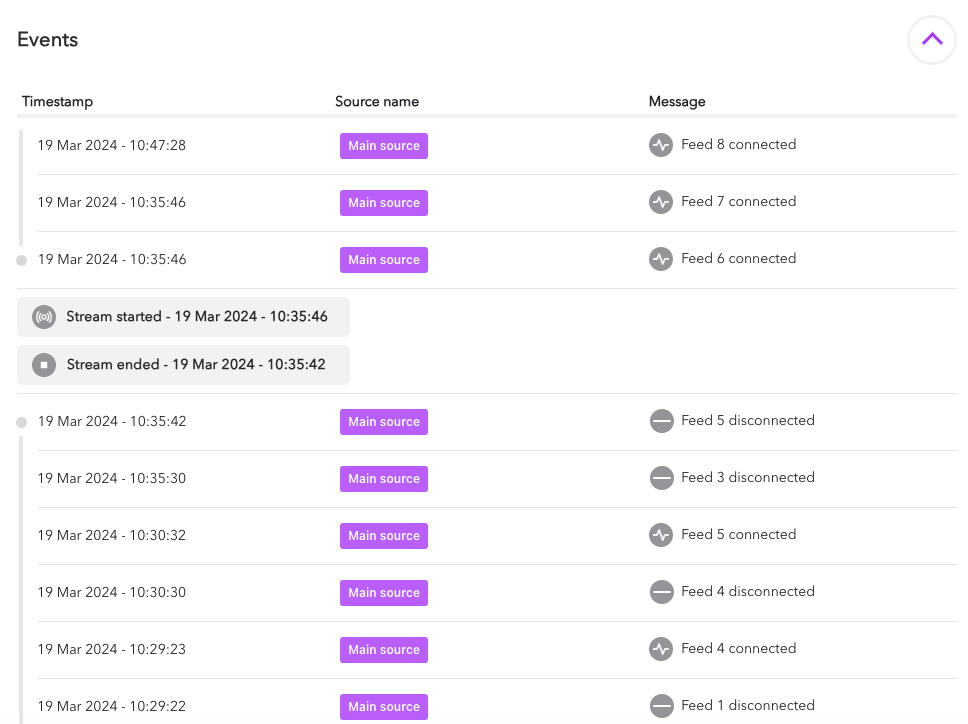
The events section for each stream displays important events that have occurred in chronological order. The name of the source under the source name column and feed ID displayed in the message column help you determine which feed is the event references.
You can view when a stream starts and ends, and when feeds connect and disconnect, when a primary feed has switched over to its redundant feed, and re-stream related events if using that feature.
Offline Streams
The live monitoring page displays the following information for streams that have been offline within the last hour. However, only the resolution, type, video codec, audio codec, publishing started, and publish geo-location statistics are available for offline streams. The additional statistics displayed in the details page are not available once the stream goes offline.
Note: Once the stream is offline for more than one hour, the stream information is no longer available in the live monitoring page.
Updated 5 months ago