Client Analytics
Diagnose Client Playback Issues and Monitor Viewer QoE
With Client Analytics, we are referring to any metrics or KPIs that help provide a better understanding of the end-user Quality of Experience (QoE). This becomes critical when there are playback issues to troubleshoot or for establishing alerts when monitoring rules meet a particular threshold.
Troubleshooting Client Playback Issues
When troubleshooting playback issues it can be helpful to first verify that the problem is not originating from the broadcast source.
Questions to consider:
- Do all client apps experience the same issue?
- Is the problem observed regardless of browser or platform being used?
If the answer is yes to either of those questions, that may indicate a broadcast problem. You can use the Millicast Interactive Multiviewer demo as a test reference for confirming the client is able to view playback.
Broadcast Monitoring
For broadcast issues, the Live Monitoring tool is available from your account Streaming Dashboard or by using the Broadcast Monitoring REST API to get more insight into what may cause problems with a stream.
Diagnostics Report
When a broadcast is healthy, there can still be scenarios where an individual playback client may experience poor player performance due to regional network disruptions, app misconfigurations, client platform versions, codec compatibility, etc.
To help facilitate investigating out why a client is experiencing a degraded experience, there is a utility function available from the Client SDKs called diagnose(). This method gathers up pertinent details such as:
✓ The version of the SDK being used.
✓ User agent of the browser and/or platform.
✓ Connection status, playback cluster, and stream account details.
✓ WebRTC stats such as round-trip time, bitrate, packet rate, mime type, resolution, jitter, etc..
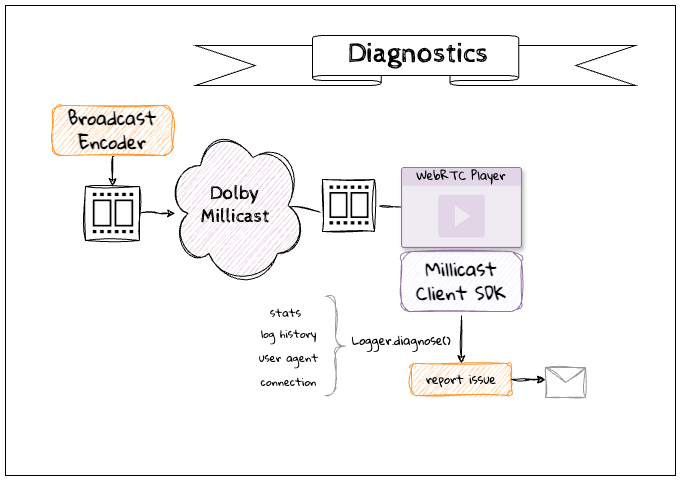
It is common to need this type of context from your application when an end user reports a problem. This level of insight can be valuable when shared with our support team to quickly find a resolution when troubleshooting.
How-to Diagnose with the Web SDK
To generate a diagnostic report, call the diagnose() method.
let report = Logger.diagnose(config);
The result is a JSON object that includes a snapshot of what was happening on the client as observed in SDK logs and statistics. When building your application, a button or menu item to report an issue that sends this data is a common pattern.
There are some options that can be used with the config to further customize the resulting report.
- By default the stats for the prior minute collected every 1s will be included in the report. By modifying statsCount this can be customized.
- A large number of logging events will be buffered and included, but this number can be extended or shortened by using the minLogLevel and historySize to indicate which logs to include and how many of them. The default is
TRACEbut can be changed to INFO or DEBUG to increase or decrease the amount of detail respectively.
let config = {
  statsCount: 120,
  historySize: 200,
  minLogLevel: 'DEBUG',
};
See the Data Dictionary below for examples of some of the data returned.
Ongoing Monitoring of Client Analytics
It is common practice to proactively monitor all clients for indicators of streaming issues. The Client SDKs provide access to a stats event that emits a snapshot of WebRTC indicators at a frequent interval. This data can be used in combination with an Application Performance Monitoring (APM) solution or Observability tool to alert and integrate with other third-party analytics services for a complete picture of the end-viewer experience.
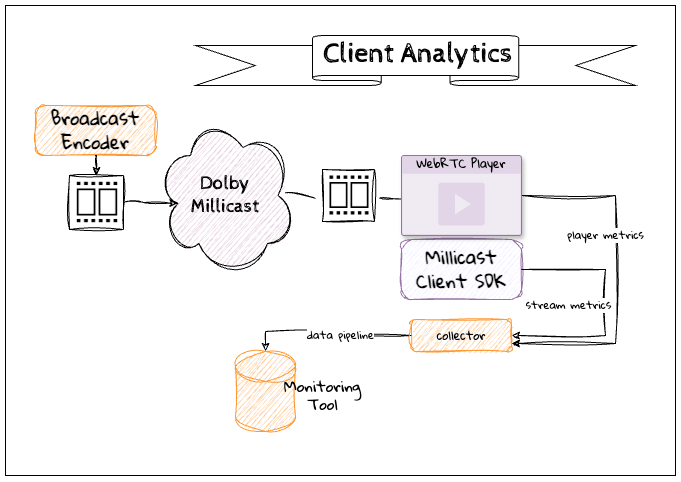
Analytics Collectors
There are third-party Client Analytics integrations available that can serve as a collector or monitoring tool for storing analytics.
The same pattern can be used with other tools such as Grafana, Splunk, New Relic, etc.
Viewer Reporting Analytics API
The Viewer Reporting REST API is a premium Analytics APIs option made available to enterprise customers. It offers key insights from our server logs to help identify viewers, location, and other metrics. If you would like to use this endpoint, please submit a support ticket or reach out to your sales/solutions contact.
How-to Configure Stats Collection Frequency
The default behavior is to emit a stats event every one second (1s). To manage bandwidth and data storage costs, this value can be tuned to meet any observability needs at higher or less frequent intervals.
// Reduce stats collection frequency to be every 5s instead of the default 1s
const option = {
  peerConfig: {
    statsIntervalMs: 5000
  }
}

await millicastViewer.connect(options);
Data Dictionary
The data measures and metrics gathered for diagnostics are described below.
Software Identification
| Measure | Definition | Troubleshooting |
|---|---|---|
| version | The version of the Client SDK that generated the analytics. | This can be helpful for debugging if you are using or testing new versions of the SDK to find signs of problems with a specific version. |
| client | An identifier for the Client SDK that was used. | This can help to distinguish analytics collected between Web, Android, iOS, React-Native, etc. which may be in a mobile browser or a native application. |
Client Environment
| Measure | Definition | Troubleshooting |
|---|---|---|
| userAgent | The user agent captured from the device and/or browser. This can identify the operating system, application versions, etc. The string is the raw unparsed value. | Codec support on platforms, devices, and browsers often come into play with playback performance. Being able to identify the user agent can be particularly helpful for diagnosing patterns. |
| timestamp | Identifies the precise date and time of the client when diagnostic measures were collected as a UTC value. | This can be helpful for correlating with other system-wide or content network events. |
Client Connection
| Measure | Definition | Troubleshooting |
|---|---|---|
| accountId | The unique identifier that is assigned to each Millicast account. It is a required parameter when publishing or subscribing to a stream. | The combination of Account ID and Stream Name can be used to identify the unique playback experience. |
| streamName | The label that is configured with publishing tokens to name a unique stream. | The combination of Account ID and Stream Name can be used to identify the unique playback experience. |
| feedId | The unique session identifier for a publishing connection to broadcast into the Millicast platform. | This id can be helpful for correlating server logs and details. |
| subscriberId | The unique session identifier for a subscribing connection to playback from the Millicast platform. | This id can be helpful for correlating server logs and details. |
| connection | The state of the connection according to the client SDK. | This can be helpful context when the client and server do not have an active connection to share analytics. |
Content Characteristics
| Measure | Definition | Troubleshooting |
|---|---|---|
| mid | The Media Stream Identifier is an identification tag negotiated and present in both local and remote descriptions for the stream with multiple tracks. | |
| mimeType | The MIME Type identifies the audio and video codecs used to encode the incoming media stream. | This can be helpful when certain platforms do not support the necessary codecs because of licensing or browser compatibility, device constraints such as set-top boxes, etc. |
| frameWidth | The width of the video frame. | Changes in resolution can be an indicator of an unstable connection. |
| frameHeight | The height of the video frame. | Changes in resolution can be an indicator of an unstable connection. |
Playback Performance
| Measure | Definition | Troubleshooting |
|---|---|---|
| bitrate | The current bitrate in bytes per second. | If the bitrate received does not match the encoded bitrate being published there may be an indication of adaptive bitrate step-down or other factors triggering layer switching to occur. |
| currentRoundTripTime | The current round trip time is the latest measure based on STUN connectivity check and response time measurements. The totalRoundTripTime is the sum. | The round trip time (RTT) is a good measure of latency experienced across clients as a measure of the time between distribution and playback. The average RTT can be computed by dividing the totalRoundTripTime by number of responsesReceived. |
| responsesReceived | The total number of connectivity check responses that have been received. | |
| availableIncomingBitrate | Calculated by congestion control from all RTP streams using the candidate pair. This is similar to the TIAS as defined in RFC3890 over a 1s window. | |
| framesReceived | The total number of complete frames received for the stream. The framesDecoded includes only those correctly decoded, framesDropped counts total number of frames lost prior to decode or that missed the display deadline. keyFramesDecoded is the total number of key frames in VP8 (RFC6386) or IDR-frames in H.264 (RFC6184) that are successfully decoded. | These values are used to calculate frames per second (FPS) which can be compared against the fps that was encoded from the source. |
| framesPerSecond | The number of frames decoded per second. | Fluctuations in fps over time or variance between encoded and decoded fps may indicate an inefficiency in the decoding and transport. |
| jitter | Deviation in packet reception times is called jitter and measured in milliseconds. The purpose of a jitter buffer is to recombine packets into frames for smooth playout. The jitterBufferDelay is the sum of time in seconds each frame takes from first packet received by the buffer to the time it is emitted and exits the buffer. The jitterBufferEmittedCount is the total number of frames. | |
| packetRate | The throughput between client and server can be measured by the client as an estimated bandwidth from CDN to player for packets received per second. The totalBytesReceived and totalPacketsReceived is the sum of bytes and RTP packets respectively. PacketsLost is the total number of RTP packets sent by the server but not received by the client which can be used to calculate packetsLossRatio and packetsLossDelta which is packets lost since the last measurement. |
Updated 8 months ago