Datazoom
Collect and Monitor Client-side Analytics with Datazoom
Datazoom enables the capture of streaming quality analytics, measurement of user engagement, tracking of content consumption, and understanding Quality of Experience (QoE) metrics that occur during playback.
This page guides you on some of the metrics that are collected and steps to integrate the Millicast SDK as a collector and connect to observability tools such as Splunk, Datadog, New Relic, Amazon Kinesis Firehose, etc.
Client Analytics
To monitor the health of your application, client analytics for monitoring and troubleshooting are critical. You can choose among many observability tools for creating a dashboard with collected data such as:
✓ Playback engagement metrics like startup time, playback rate, pause events, and durations
✓ Device analytics such as user agent, browser, operating system, device size, versions
✓ Geolocation details including country, city, IP address, and network details
✓ WebRTC statistics like fps, round trip time, jitter, packet and frame loss rates, and bitrate
When combined with our Live Monitoring and Stream Syndication capabilities you can effectively monitor playback issues and track viewer characteristics.
Setting Up Datazoom with the Web SDK
This section outlines the steps required to initialize client-side data collection with the Millicast Web SDK. There are also collectors available that will work similarly with Android and iOS.
1. Include Datazoom Beacon
Include the Datazoom library with your configuration id:
<script src="https://platform.datazoom.io/beacon/v1/config?configuration_id=4a1ef...7a"></script>
2. Track Player Engagement
Attaching a context on the player will gather user engagement details like when the stream is paused and how long it took from play to start displaying video.
 millicastView.on("track", (event) => {
   // ...
   window.datazoom.createContext(videoElement);
 });
3. Collect Custom WebRTC Stats
See the Client Analytics guide to learn more about what media statistics and metrics are captured for the WebRTC connection.
 millicastView.webRTCPeer.on("stats", (stats) => {
     window.datazoom.setMetadata({ webRTCStats: stats });
 });
This will collect statistics every second. To reduce frequency of collection, you can keep a counter and reduce the number of calls to window.datazoom.setMetadata.
// Only store metrics every 60 seconds
const statCollectionInterval = 60;

let statsTicker = 0;
millicastView.webRTCPeer.on("stats", (stats) => {
    if (statsTicker >= statCollectionInterval) {
       window.datazoom.setMetadata({ webRTCStats: stats });
       statsTicker = 0;
    } else {
       statsTicker++;
    }
});
4. Monitor with a Datazoom Connector
Datazoom provides connectors on their platform that can be used to aggregate client metrics in your observability and monitoring tools.
Splunk
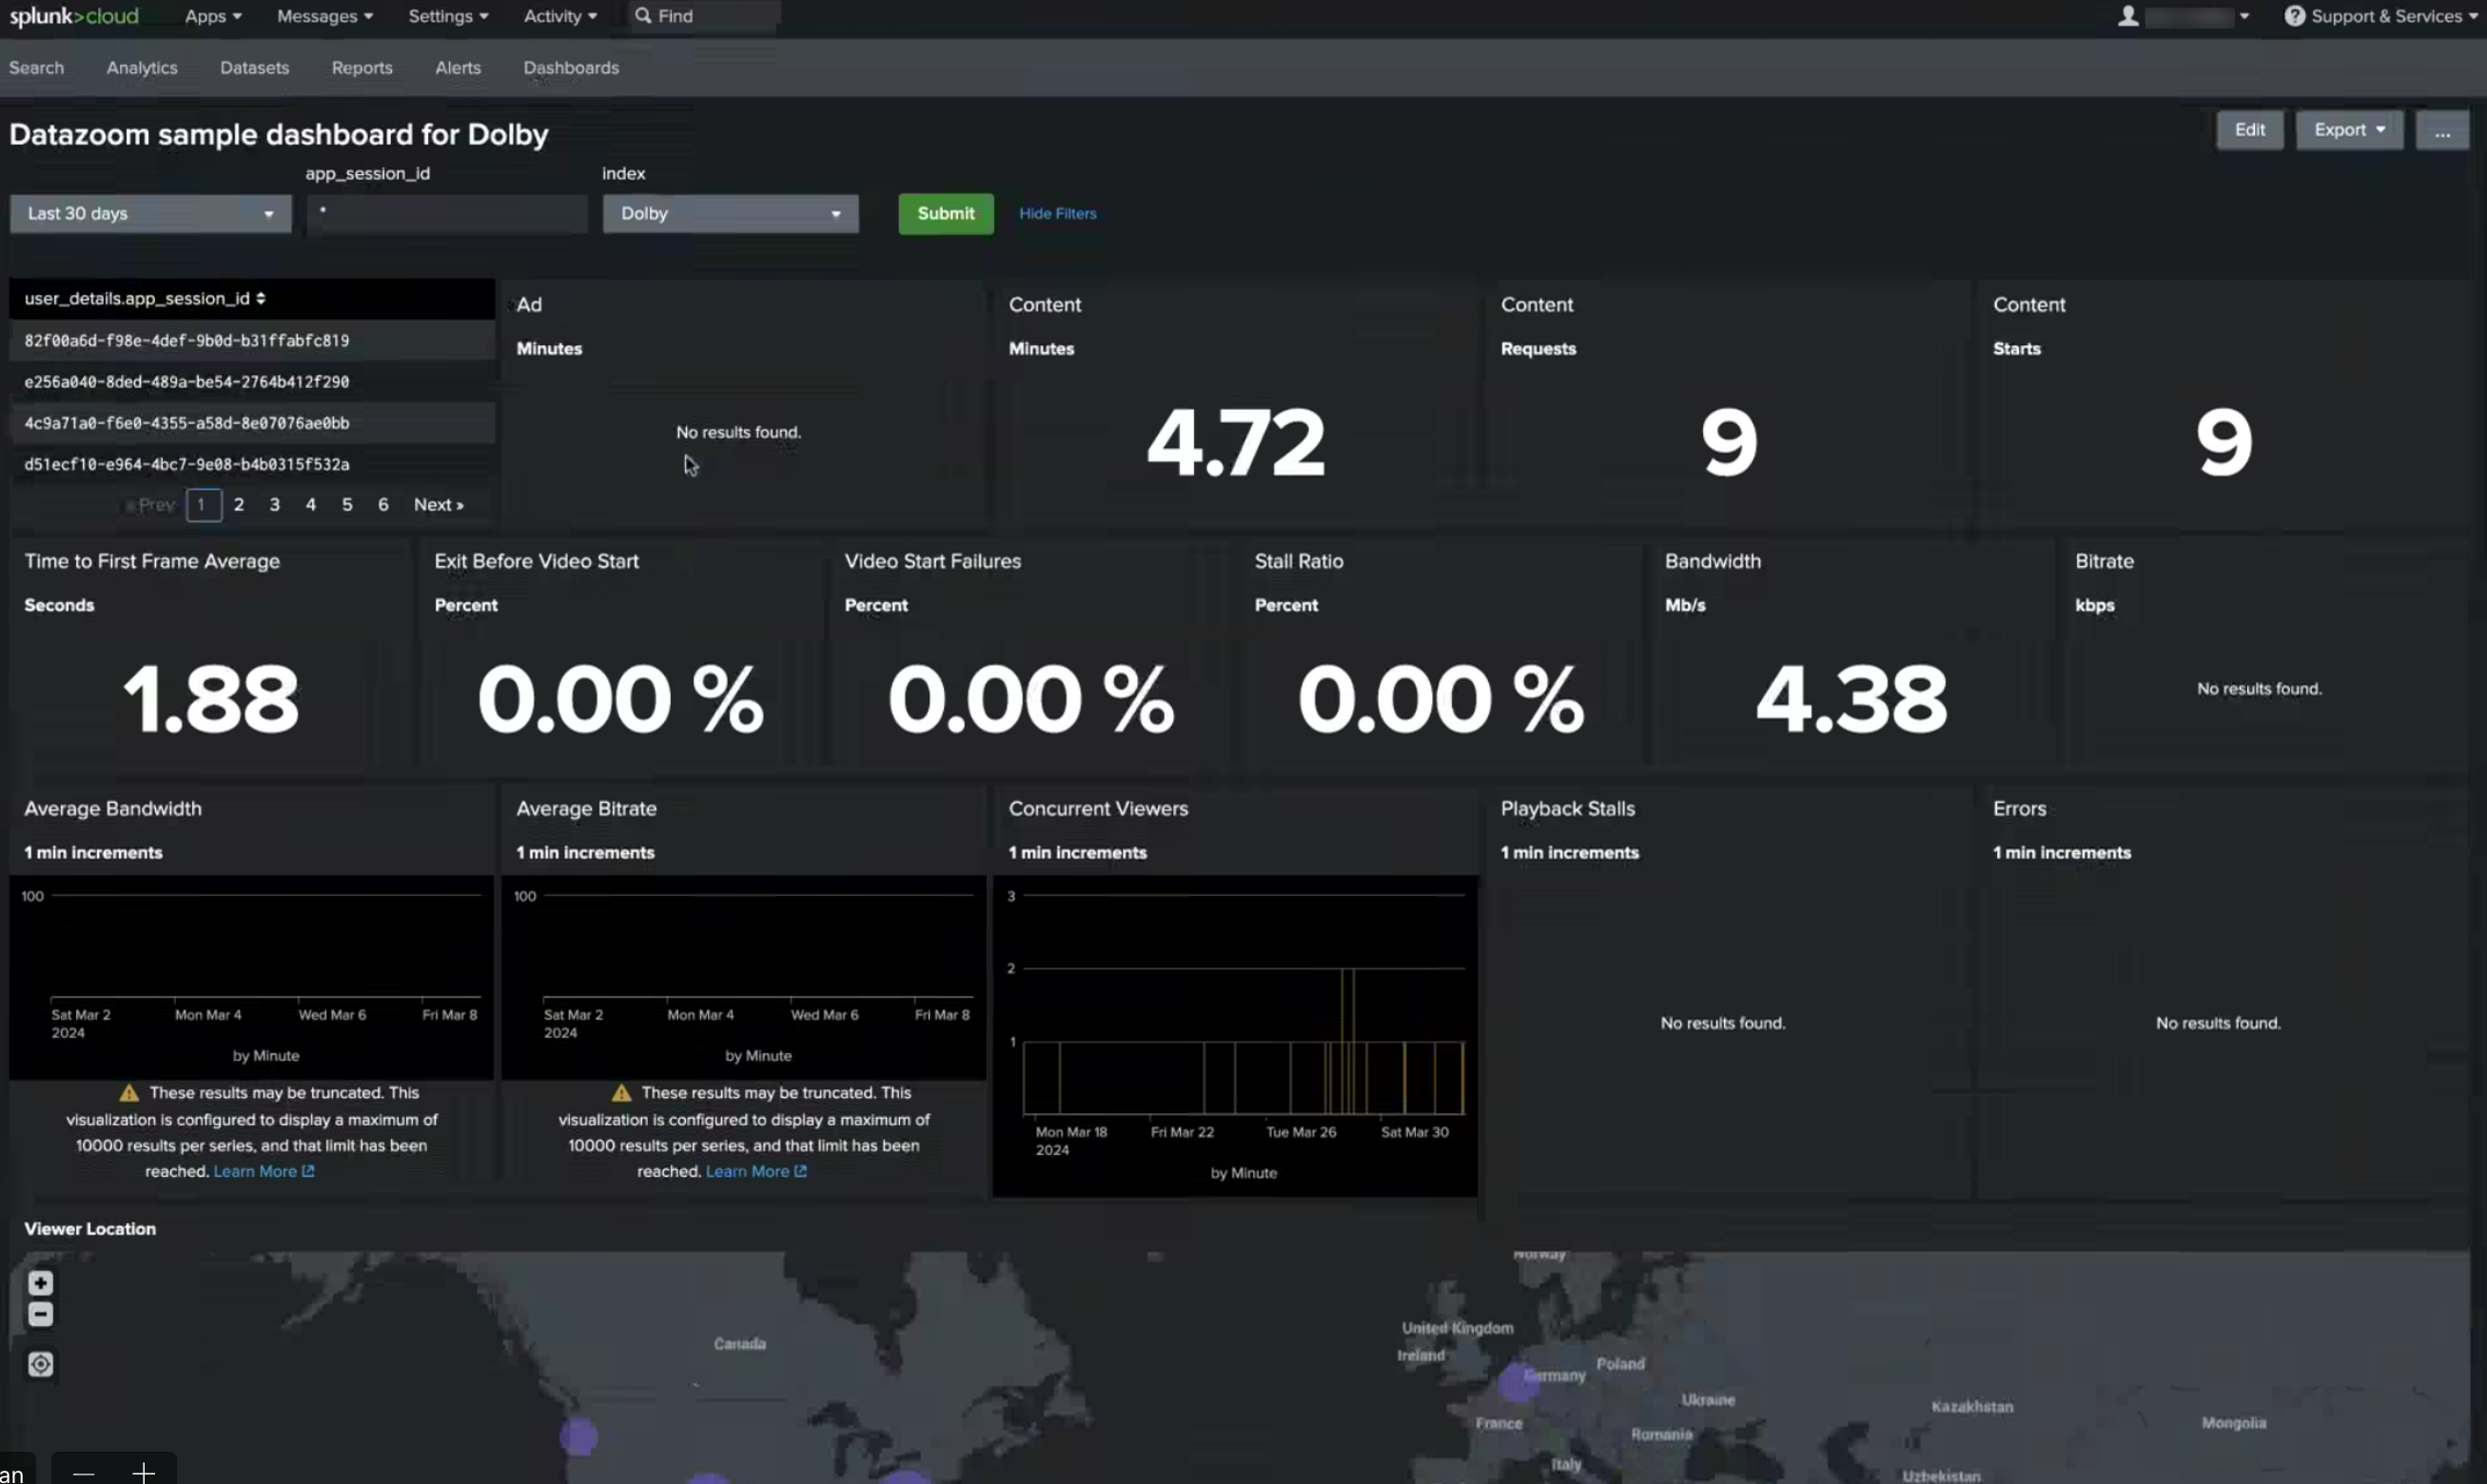
Here is a preview of what a dashboard might look like in Splunk:

Datadog
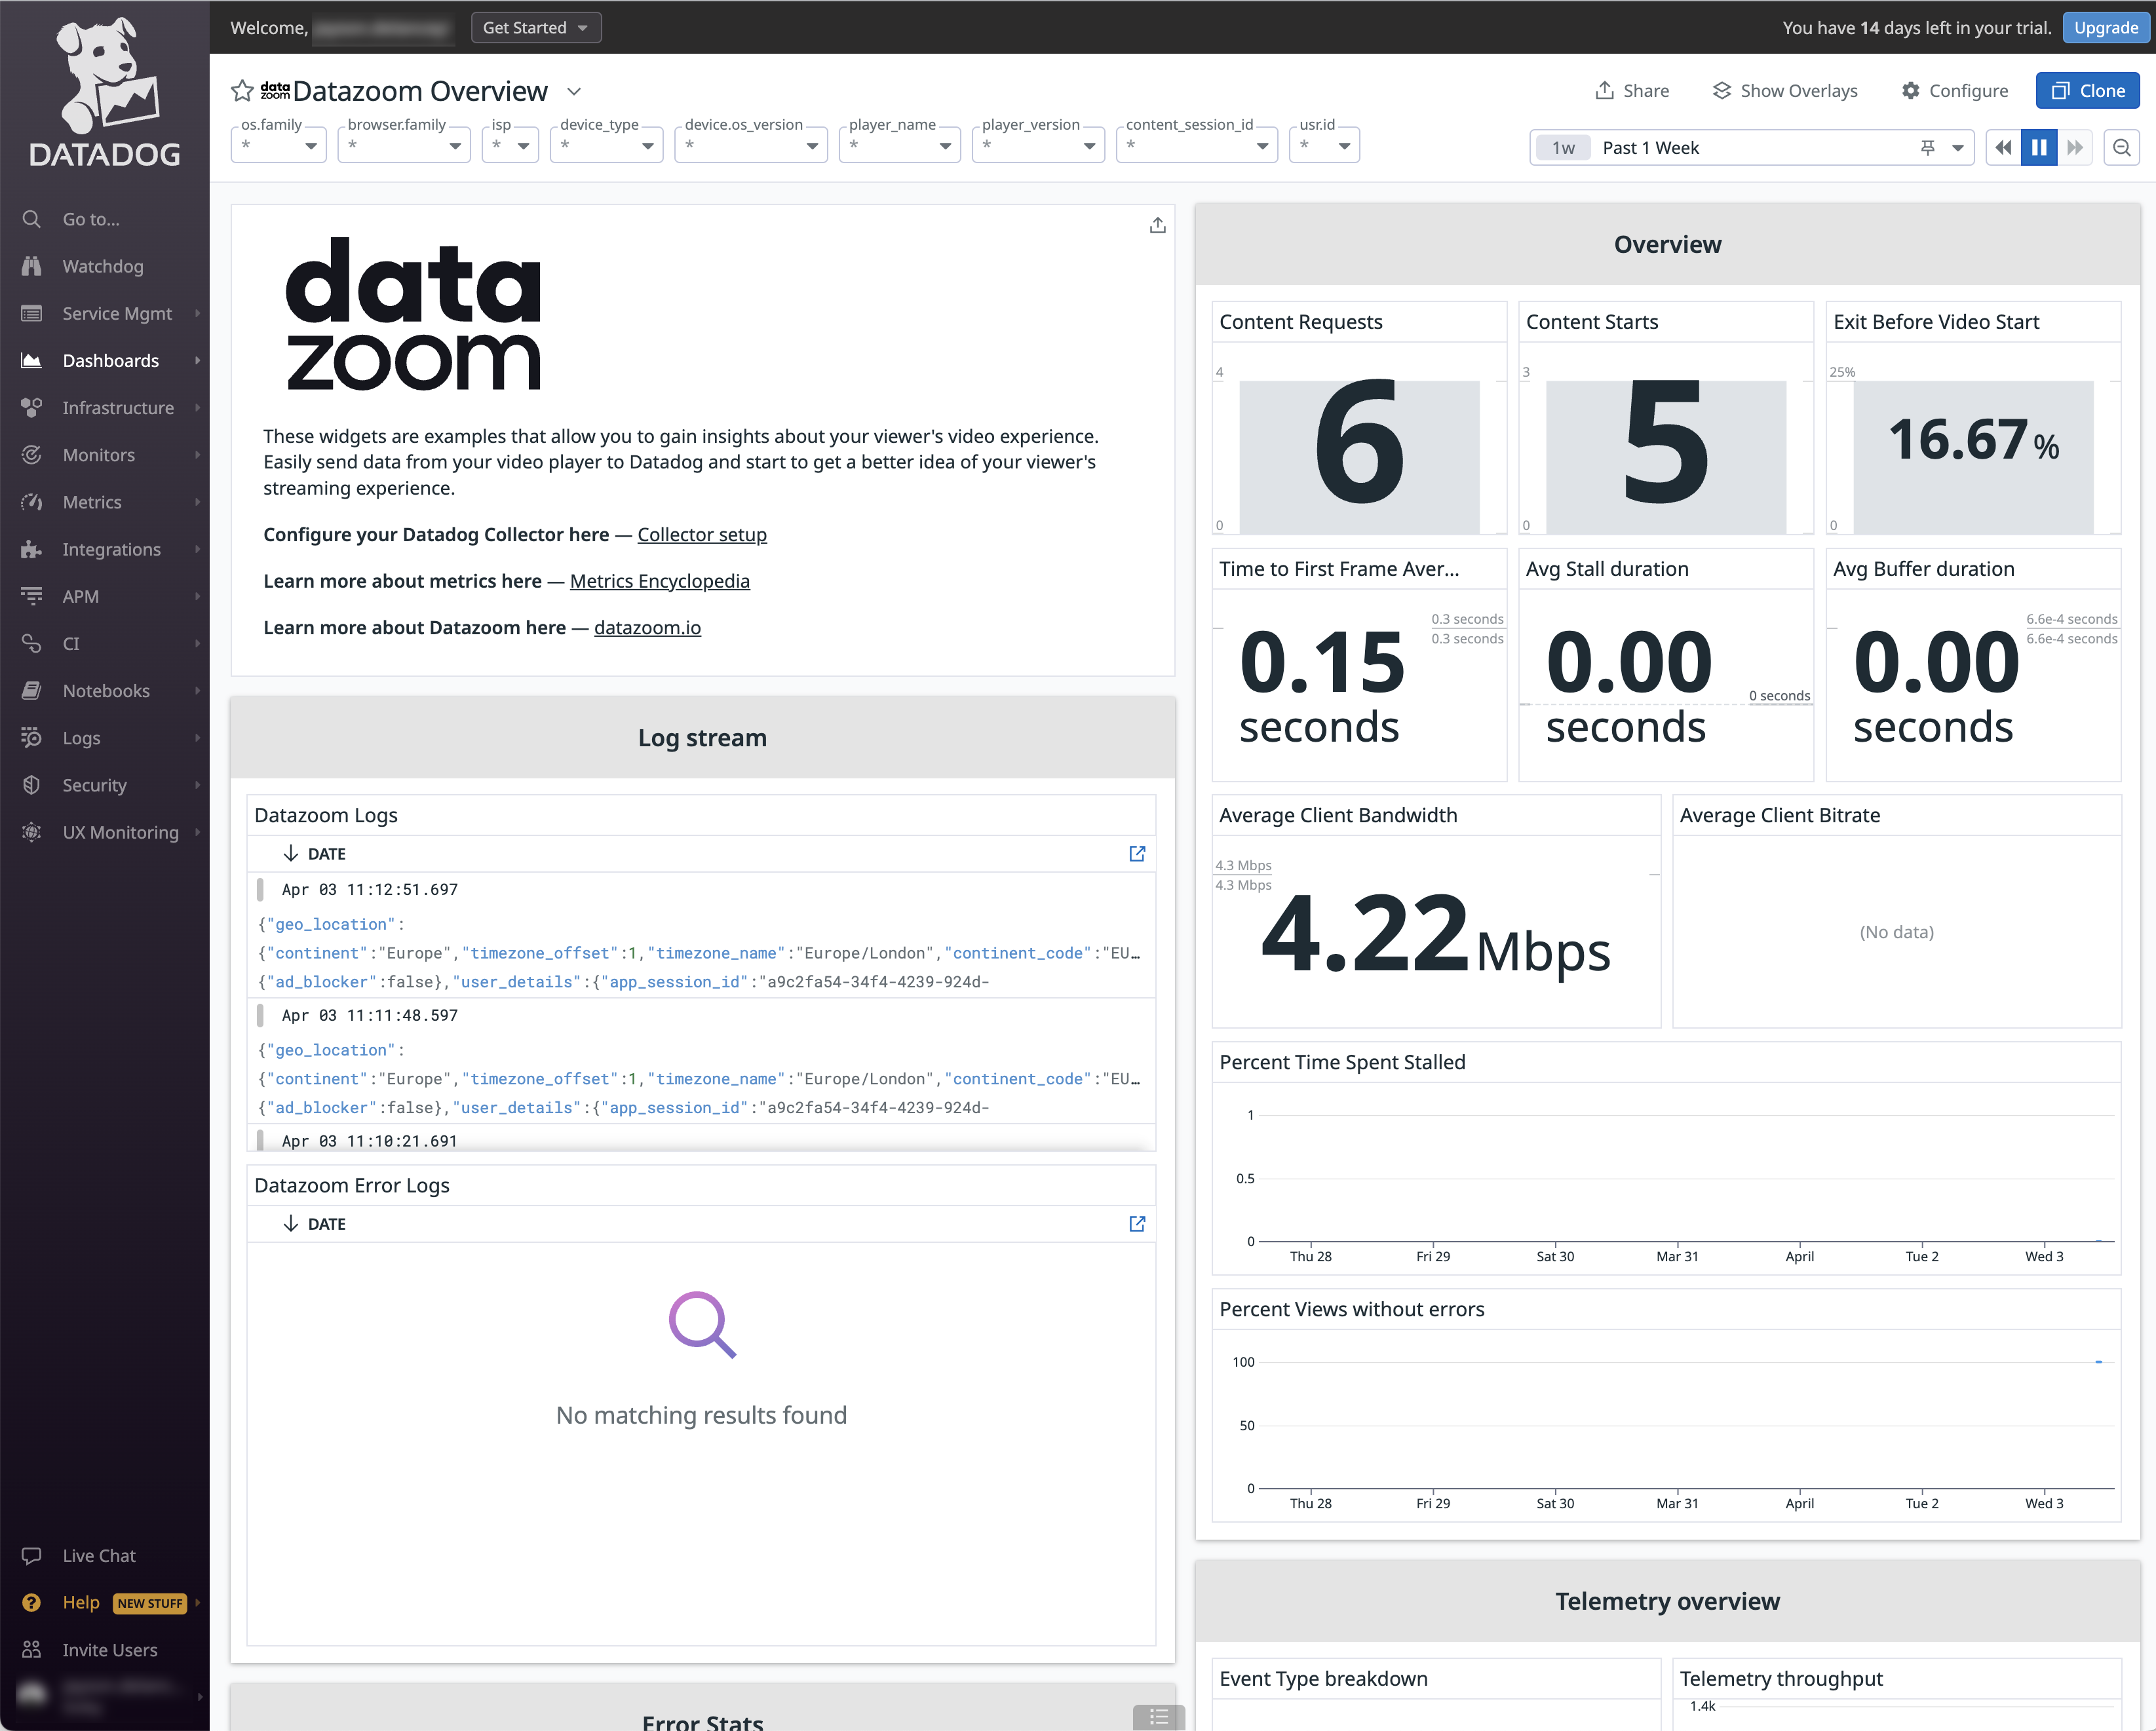
Here is a preview of what a dashboard might look like in Datadog:

Sample
Here is an example payload from the Datazoom connector:
[
    {
        "event": {
            "metrics": {
                "engagement_duration_ms": 11653618,
                "num_ad_plays": 0,
                "num_content_plays": 23,
                "num_errors": 0,
                "num_errors_ads": 0,
                "num_errors_content": 0,
                "num_requests_content": 23,
                "bandwidth_kbps": 4200,
                "buffer_duration_ms": 0,
                "buffer_duration_ads_ms": 0,
                "buffer_duration_content_ms": 0,
                "buffer_length_ms": 0,
                "content_session_start_ts_ms": 1712167309643,
                "pause_duration_ms": 0,
                "pause_duration_ads_ms": 0,
                "pause_duration_content_ms": 0,
                "playback_duration_ms": 2640,
                "playback_duration_ads_ms": 0,
                "playback_duration_content_ms": 2640,
                "playback_rate": 1,
                "player_state": "playing",
                "player_viewable": true,
                "player_viewable_percent": 100,
                "playhead_position_sec": 2.686,
                "rendition_height": 1080,
                "rendition_name": "1080p",
                "rendition_width": 1920,
                "stall_count": 0,
                "stall_count_ads": 0,
                "stall_count_content": 0,
                "stall_duration_ms": 0,
                "stall_duration_ads_ms": 0,
                "stall_duration_content_ms": 0,
                "time_since_last_ad_break_start_ms": 0,
                "time_since_last_ad_completed_ms": 0,
                "time_since_last_buffer_start_ms": 2640,
                "time_since_last_buffer_start_ad_ms": 0,
                "time_since_last_buffer_start_content_ms": 2640,
                "time_since_last_heartbeat_ms": 0,
                "time_since_last_milestone_ad_ms": 0,
                "time_since_last_milestone_content_ms": 0,
                "time_since_last_pause_ms": 0,
                "time_since_last_rendition_change_ms": 600,
                "time_since_last_request_ad_ms": 0,
                "time_since_last_seek_start_ms": 0,
                "time_since_last_stall_start_ms": 0,
                "time_since_last_stall_start_ad_ms": 0,
                "time_since_last_stall_start_content_ms": 0,
                "time_since_last_started_ad_ms": 0,
                "time_since_request_content_ms": 2641,
                "time_since_started_content_ms": 2640,
                "volume_level_percent": 100,
                "event_count": 591
            },
            "attributes": {
                "abs_shift": "up"
            },
            "type": "rendition_change",
            "timestamp": 1712167312284
        },
        "configuration_id": "4a3...a",
        "connector_list": "dz-connector-splunk,dz-connector-kinesis-firehose,dz-connector-datadog",
        "customer_code": "486...f",
        "user_details": {
            "app_session_id": "a9c...2",
            "app_session_start_ts_ms": 1712155658666,
            "client_ip": "128.n.n.0",
            "user_agent": "Mozilla/5.0 (Macintosh; Intel Mac OS X 10_15_7) AppleWebKit/537.36 (KHTML, like Gecko) Chrome/123.0.0.0 Safari/537.36",
            "content_session_id": "c12...2"
        },
        "player": {
            "player_name": "HTML5 Native Player",
            "autostart": true,
            "default_muted": true,
            "default_playback_rate": 1,
            "fullscreen": false,
            "loop": false,
            "muted": true,
            "preload": "none",
            "ready_state": 4,
            "streaming_protocol": ""
        },
        "device": {
            "browser_name": "Chrome",
            "browser_height": 1334,
            "browser_version": "123.0.0.0",
            "browser_width": 1904,
            "cookies_enabled": true,
            "device_id": "bc6...3",
            "device_type": "pc",
            "os_name": "Mac OS X",
            "os_version": "10.15.7"
        },
        "geo_location": {
            "city": "London",
            "country": "United Kingdom",
            "country_code": "GB",
            "latitude": 51.5074,
            "longitude": -0.1196,
            "postal_code": "EC1N",
            "region": "England",
            "region_code": "ENG",
            "continent": "Europe",
            "continent_code": "EU",
            "district": "",
            "timezone_name": "Europe/London",
            "timezone_offset": 1
        },
        "ops_metadata": {
            "server_ts_offset_ms": 208,
            "player_context_id": "360...2",
            "collector_observability": [
                {
                    "time": 1712167311684,
                    "metric_name": "process_duration_ms",
                    "dimension": {
                        "target": "log",
                        "attempt_count": 1,
                        "status_code": 200
                    },
                    "metric_value": 171
                },
                {
                    "time": 1712167311684,
                    "metric_name": "queue_duration_ms",
                    "dimension": {
                        "target": "log"
                    },
                    "metric_value": 56
                },
                {
                    "time": 1712167311740,
                    "metric_name": "send_duration_ms",
                    "dimension": {
                        "target": "log",
                        "attempt_count": 1,
                        "status_code": 200
                    },
                    "metric_value": 115
                },
                {
                    "time": 1712167311740,
                    "metric_name": "call_duration_ms",
                    "dimension": {
                        "target": "log",
                        "attempt": 1,
                        "status_code": 200
                    },
                    "metric_value": 115
                }
            ]
        },
        "ad": {
            "ad_blocker": false
        },
        "video": {
            "media_type": "content",
            "player_height": 360,
            "player_width": 640,
            "source": ""
        },
        "custom": {
            "webRTCStats": {
                "audio": {
                    "inbounds": [
                        {
                            "mimeType": "audio/opus",
                            "timestamp": 1712167311343.687,
                            "totalBytesReceived": 23460,
                            "totalPacketsReceived": 94,
                            "totalPacketsLost": 0,
                            "jitter": 0.004,
                            "id": "IT0...2",
                            "mid": "1",
                            "trackIdentifier": "ad9...a",
                            "bitrate": 100952,
                            "packetsLostRatioPerSecond": 0,
                            "packetsLostDeltaPerSecond": 0
                        }
                    ],
                    "outbounds": []
                },
                "video": {
                    "inbounds": [
                        {
                            "mimeType": "video/H264",
                            "framesPerSecond": 20,
                            "frameHeight": 540,
                            "frameWidth": 960,
                            "timestamp": 1712167311343.687,
                            "totalBytesReceived": 256532,
                            "totalPacketsReceived": 1057,
                            "totalPacketsLost": 0,
                            "jitter": 0.003,
                            "id": "IT0...8",
                            "mid": "0",
                            "trackIdentifier": "dd8...4",
                            "bitrate": 1244344,
                            "packetsLostRatioPerSecond": 0,
                            "packetsLostDeltaPerSecond": 0
                        }
                    ],
                    "outbounds": []
                },
                "raw": {},
                "totalRoundTripTime": 0.031,
                "currentRoundTripTime": 0.005,
                "availableOutgoingBitrate": 300000,
                "candidateType": "prflx"
            }
        },
        "event_id": "a9c...0"
    }
]
Updated 8 months ago